Running and Quitting
Overview
Teaching: 6 min
Exercises: 2 minQuestions
How can I run Python programs?
Objectives
Launch the JupyterLab server.
Create a Jupyter notebook.
Shutdown the JupyterLab server.
Create and run Python cells in a notebook.
Getting Started with JupyterLab
JupyterLab is included as part of the Anaconda Python distribution. If you have not already installed the Anaconda Python distribution, see the setup instructions for installation instructions.
Starting JupyterLab
You can start the JupyterLab server through the command line or through an application called
Anaconda Navigator. Anaconda Navigator is included as part of the Anaconda Python distribution.
macOS - Command Line
To start the JupyterLab server you will need to access the command line through the Terminal. There are two ways to open Terminal on Mac.
- In your Applications folder, open Utilities and double-click on Terminal
- Press Command + spacebar to launch Spotlight. Type
Terminaland then double-click the search result or hit Enter
After you have launched Terminal, type the command to launch the JupyterLab server.
$ jupyter lab
Windows Users - Command Line
To start the JupyterLab server you will need to access the Anaconda Prompt.
Press Windows Logo Key and search for Anaconda Prompt, click the result or press enter.
After you have launched the Anaconda Prompt, type the command:
$ jupyter lab
Anaconda Navigator
To start a JupyterLab server from Anaconda Navigator you must first start Anaconda Navigator (click for detailed instructions on macOS, Windows, and Linux). You can search for Anaconda Navigator via Spotlight on macOS (Command + spacebar), the Windows search function (Windows Logo Key) or opening a terminal shell and executing the anaconda-navigator executable from the command line.
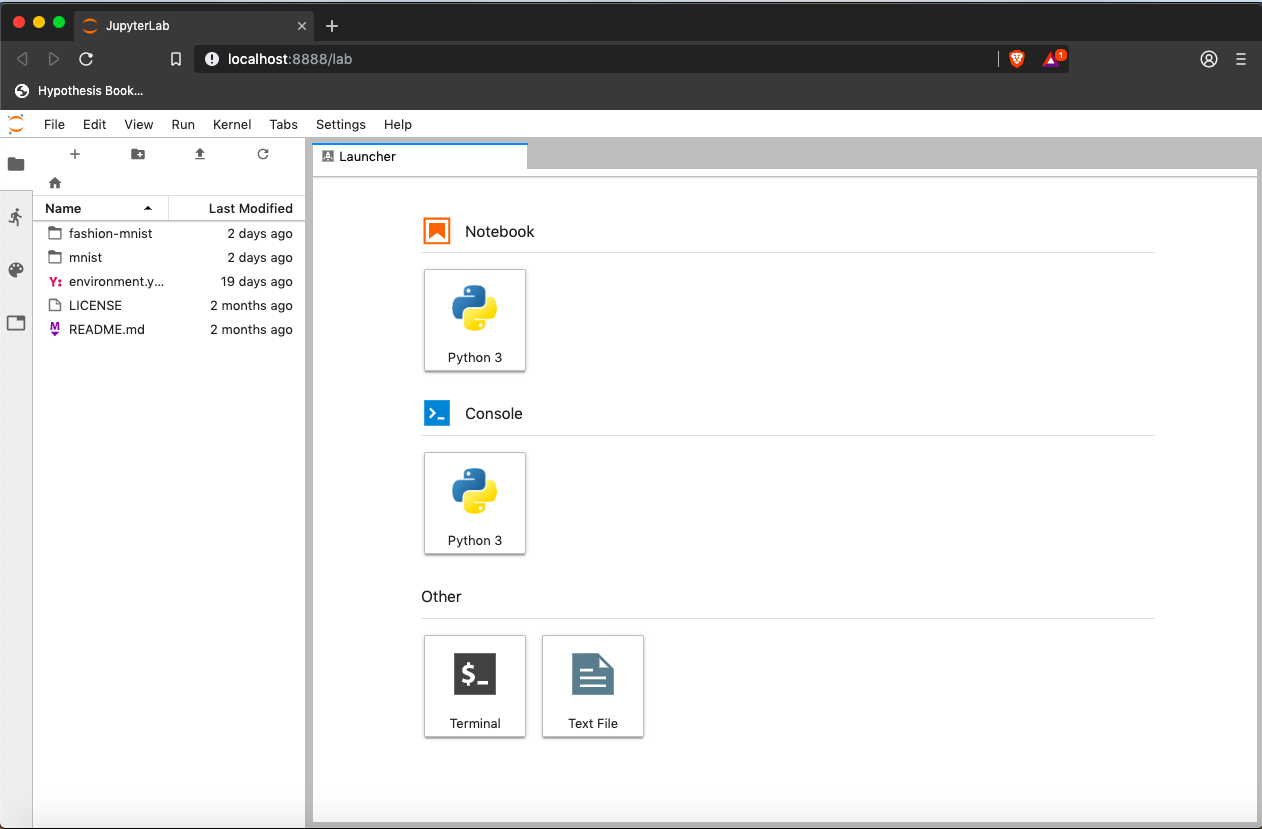
After you have launched Anaconda Navigator, click the Launch button under JupyterLab. You may need
to scroll down to find it.
Here is a screenshot of a JupyterLab landing page that should be similar to the one that opens in your default web browser after starting the JupyterLab server on either macOS or Windows.
The JupyterLab Interface
JupyterLab has many features found in traditional integrated development environments (IDEs) but is focused on providing flexible building blocks for interactive, exploratory computing.
The JupyterLab Interface consists of the Menu Bar, a collapsable Left Side Bar, and the Main Work Area which contains tabs of documents and activities.
Left Sidebar
The left sidebar contains a number of commonly used tabs, such as a file browser (showing the contents of the directory where the JupyterLab server was launched), a list of running kernels and terminals, the command palette, and a list of open tabs in the main work area. A screenshot of the default Left Side Bar is provided below.
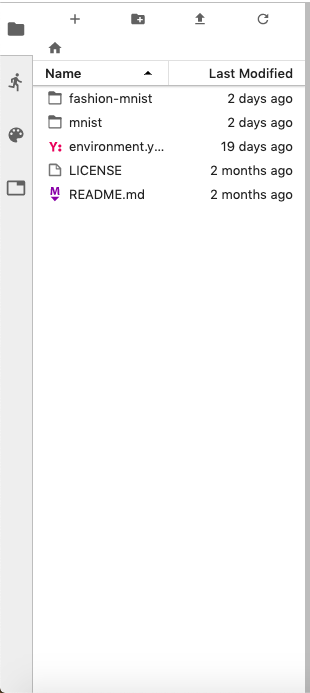
The left sidebar can be collapsed or expanded by selecting “Show Left Sidebar” in the View menu or by clicking on the active sidebar tab.
Main Work Area
The main work area in JupyterLab enables you to arrange documents (notebooks, text files, etc.) and other activities (terminals, code consoles, etc.) into panels of tabs that can be resized or subdivided. A screenshot of the default Main Work Area is provided below.
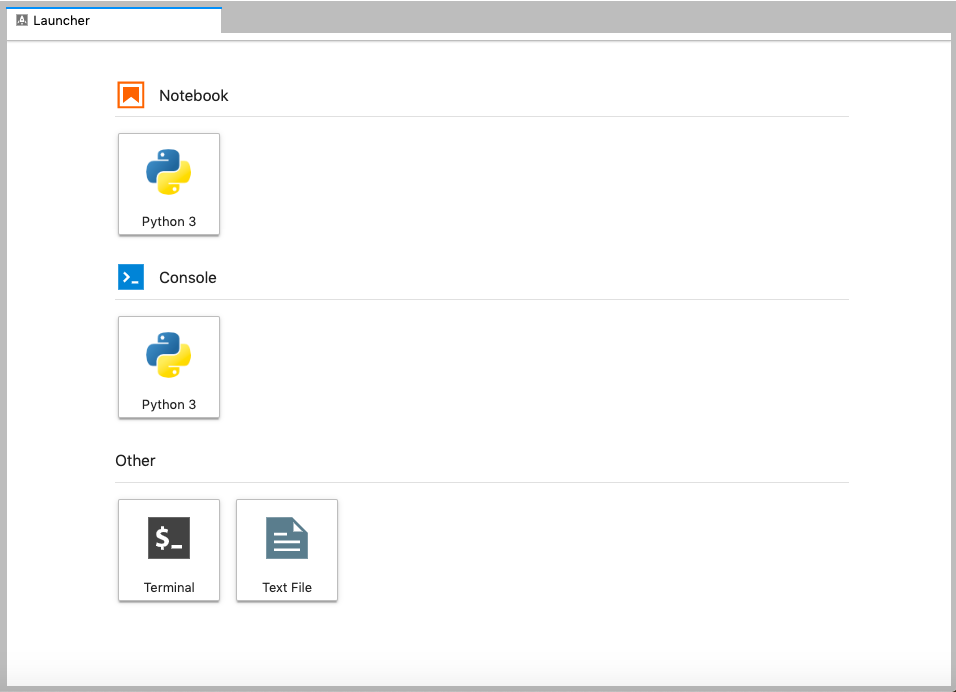
Creating a Jupyter Notebook
To open a new notebook click the Python 3 icon under the Notebook header in the Launcher tab in the main work area. You can also create a new notebook by selecting New -> Notebook from the File menu in the Menu Bar.
A note on Jupyter notebooks.
- Notebook files have the extension
.ipynbto distinguish them from plain-text Python programs.
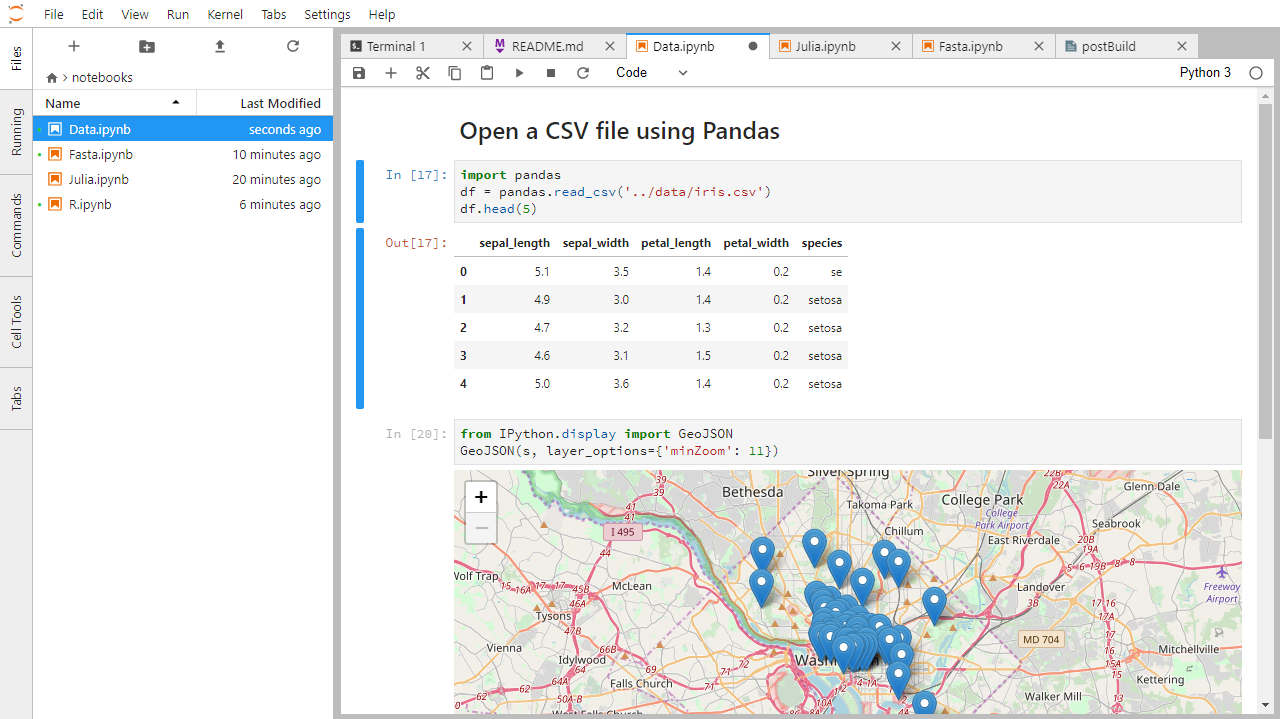
Below is a screenshot of a Jupyter notebook running inside JupyterLab. If you are interested in more details, then see the official notebook documentation.
Code vs. Text
Jupyter mixes code and text in different types of blocks, called cells. We often use the term “code” to mean “the source code of software written in a language such as Python”. A “code cell” in a Notebook is a cell that contains software; a “text cell” is one that contains ordinary prose written for human beings.
The Notebook has Command and Edit modes.
- If you press Esc and Return alternately, the outer border of your code cell will change from gray to blue.
- These are the Command (gray) and Edit (blue) modes of your notebook.
- Command mode allows you to edit notebook-level features, and Edit mode changes the content of cells.
- When in Command mode (esc/gray),
- The b key will make a new cell below the currently selected cell.
- The a key will make one above.
- The x key will delete the current cell.
- The z key will undo your last cell operation (which could be a deletion, creation, etc).
- All actions can be done using the menus, but there are lots of keyboard shortcuts to speed things up.
Command Vs. Edit
In the Jupyter notebook page are you currently in Command or Edit mode?
Switch between the modes. Use the shortcuts to generate a new cell. Use the shortcuts to delete a cell. Use the shortcuts to undo the last cell operation you performed.Solution
Command mode has a grey border and Edit mode has a blue border. Use Esc and Return to switch between modes. You need to be in Command mode (Press Esc if your cell is blue). Type b or a. You need to be in Command mode (Press Esc if your cell is blue). Type x. You need to be in Command mode (Press Esc if your cell is blue). Type z.
Use the keyboard and mouse to select and edit cells.
- Pressing the Return key turns the border blue and engages Edit mode, which allows you to type within the cell.
- Because we want to be able to write many lines of code in a single cell, pressing the Return key when in Edit mode (blue) moves the cursor to the next line in the cell just like in a text editor.
- We need some other way to tell the Notebook we want to run what’s in the cell.
- Pressing Shift+Return together will execute the contents of the cell.
- Notice that the Return and Shift keys on the right of the keyboard are right next to each other.
More Math
What is displayed when a Python cell in a notebook that contains several calculations is executed? For example, what happens when this cell is executed?
7 * 3
2 + 1
Solution
Python returns the output of the last calculation.
3
Closing JupyterLab
- From the Menu Bar select the “File” menu and then choose “Shut Down” at the bottom of the dropdown menu. You will be prompted to confirm that you wish to shutdown the JupyterLab server (don’t forget to save your work!). Click “Shut Down” to shutdown the JupyterLab server.
- To restart the JupyterLab server you will need to re-run the following command from a shell.
$ jupyter lab
Closing JupyterLab
Practice closing and restarting the JupyterLab server.
Key Points
Use the Jupyter Notebook for editing and running Python.
The Notebook has Command and Edit modes.
Use the keyboard and mouse to select and edit cells.
Variables and Assignment
Overview
Teaching: 8 min
Exercises: 4 minQuestions
How can I store data in programs?
Objectives
Write programs that assign scalar values to variables and perform calculations with those values.
Correctly trace value changes in programs that use scalar assignment.
Use variables to store values.
- Variables are names for values.
- In Python the
=symbol assigns the value on the right to the name on the left. - The variable is created when a value is assigned to it.
-
Here, Python assigns an age to a variable
ageand a name in quotes to a variablefirst_name.age = 42 first_name = 'Ahmed' - Variable names
- can only contain letters, digits, and underscore
_(typically used to separate words in long variable names) - cannot start with a digit
- are case sensitive (age, Age and AGE are three different variables)
- can only contain letters, digits, and underscore
- Variable names that start with underscores like
__alistairs_real_agehave a special meaning so we won’t do that until we understand the convention.
Use print to display values.
- Python has a built-in function called
printthat prints things as text. - Call the function (i.e., tell Python to run it) by using its name.
- Provide values to the function (i.e., the things to print) in parentheses.
- To add a string to the printout, wrap the string in single or double quotes.
- The values passed to the function are called arguments
print(first_name, 'is', age, 'years old')
Ahmed is 42 years old
printautomatically puts a single space between items to separate them.- And wraps around to a new line at the end.
Variables must be created before they are used.
- If a variable doesn’t exist yet, or if the name has been mis-spelled, Python reports an error. (Unlike some languages, which “guess” a default value.)
print(last_name)
---------------------------------------------------------------------------
NameError                                 Traceback (most recent call last)
<ipython-input-1-c1fbb4e96102> in <module>()
----> 1 print(last_name)

NameError: name 'last_name' is not defined
- The last line of an error message is usually the most informative.
- We will look at error messages in detail later.
Variables can be used in calculations.
- We can use variables in calculations just as if they were values.
- Remember, we assigned the value
42toagea few lines ago.
- Remember, we assigned the value
age = age + 3
print('Age in three years:', age)
Age in three years: 45
Use an index to get a single character from a string.
- The characters (individual letters, numbers, and so on) in a string are
ordered. For example, the string
'AB'is not the same as'BA'. Because of this ordering, we can treat the string as a list of characters. - Each position in the string (first, second, etc.) is given a number. This number is called an index or sometimes a subscript.
- Indices are numbered from 0.
- Use the position’s index in square brackets to get the character at that position.

atom_name = 'helium'
print(atom_name[0])
h
Use a slice to get a substring.
- A part of a string is called a substring. A substring can be as short as a single character.
- An item in a list is called an element. Whenever we treat a string as if it were a list, the string’s elements are its individual characters.
- A slice is a part of a string (or, more generally, any list-like thing).
- We take a slice by using
[start:stop], wherestartis replaced with the index of the first element we want andstopis replaced with the index of the element just after the last element we want. - Mathematically, you might say that a slice selects
[start:stop). - The difference between
stopandstartis the slice’s length. - Taking a slice does not change the contents of the original string. Instead, the slice is a copy of part of the original string.
atom_name = 'sodium'
print(atom_name[0:3])
sod
Use the built-in function len to find the length of a string.
print(len('helium'))
6
- Nested functions are evaluated from the inside out, like in mathematics.
Python is case-sensitive.
- Python thinks that upper- and lower-case letters are different,
so
Nameandnameare different variables. - There are conventions for using upper-case letters at the start of variable names so we will use lower-case letters for now.
Use meaningful variable names.
- Python doesn’t care what you call variables as long as they obey the rules (alphanumeric characters and the underscore).
flabadab = 42
ewr_422_yY = 'Ahmed'
print(ewr_422_yY, 'is', flabadab, 'years old')
- Use meaningful variable names to help other people understand what the program does.
- The most important “other person” is your future self.
Predicting Values
What is the final value of
positionin the program below? (Try to predict the value without running the program, then check your prediction.)initial = 'left' position = initial initial = 'right'Solution
'left'The
initialvariable is assigned the value'left'. In the second line, thepositionvariable also receives the string value'left'. In third line, theinitialvariable is given the value'right', but thepositionvariable retains its string value of'left'.
Slicing practice
What does the following program print?
atom_name = 'carbon'
print('atom_name[1:3] is:', atom_name[1:3])
Solution
atom_name[1:3] is: ar
Key Points
Use variables to store values.
Use
Variables must be created before they are used.
Variables can be used in calculations.
Use an index to get a single character from a string.
Use a slice to get a substring.
Use the built-in function
lento find the length of a string.Python is case-sensitive.
Use meaningful variable names.
Data Types and Type Conversion
Overview
Teaching: 5 min
Exercises: 7 minQuestions
What kinds of data do programs store?
How can I convert one type to another?
Objectives
Explain key differences between integers and floating point numbers.
Explain key differences between numbers and character strings.
Use built-in functions to convert between integers, floating point numbers, and strings.
Every value has a type.
- Every value in a program has a specific type.
- Integer (
int): represents positive or negative whole numbers like 3 or -512. - Floating point number (
float): represents real numbers like 3.14159 or -2.5. - Character string (usually called “string”,
str): text.- Written in either single quotes or double quotes (as long as they match).
- The quote marks aren’t printed when the string is displayed.
Use the built-in function type to find the type of a value.
- Use the built-in function
typeto find out what type a value has. - Works on variables as well.
print(type(52))
<class 'int'>
fitness = 'average'
print(type(fitness))
<class 'str'>
Types control what operations (or methods) can be performed on a given value.
- A value’s type determines what the program can do to it.
print(5 - 3)
2
print('hello' - 'h')
---------------------------------------------------------------------------
TypeError                                 Traceback (most recent call last)
<ipython-input-2-67f5626a1e07> in <module>()
----> 1 print('hello' - 'h')

TypeError: unsupported operand type(s) for -: 'str' and 'str'
You can use the “+” operator on strings.
- “Adding” character strings concatenates them.
full_name = 'Ahmed' + ' ' + 'Walsh'
print(full_name)
Ahmed Walsh
Must convert numbers to strings or vice versa when operating on them.
- Cannot add numbers and strings.
print(1 + '2')
---------------------------------------------------------------------------
TypeError                                 Traceback (most recent call last)
<ipython-input-4-fe4f54a023c6> in <module>()
----> 1 print(1 + '2')

TypeError: unsupported operand type(s) for +: 'int' and 'str'
- Not allowed because it’s ambiguous: should
1 + '2'be3or'12'? - Some types can be converted to other types by using the type name as a function.
print(1 + int('2'))
print(str(1) + '2')
3
12
Can mix integers and floats freely in operations.
- Integers and floating-point numbers can be mixed in arithmetic.
- Python 3 automatically converts integers to floats as needed.
print('half is', 1 / 2.0)
print('three squared is', 3.0 ** 2)
half is 0.5
three squared is 9.0
Variables only change value when something is assigned to them.
- If we make one cell in a spreadsheet depend on another, and update the latter, the former updates automatically.
- This does not happen in programming languages.
variable_one = 1
variable_two = 5 * variable_one
variable_one = 2
print('first is', variable_one, 'and second is', variable_two)
first is 2 and second is 5
- The computer reads the value of
firstwhen doing the multiplication, creates a new value, and assigns it tosecond. - After that,
seconddoes not remember where it came from.
Automatic Type Conversion
What type of value is 3.25 + 4?
Solution
It is a float: integers are automatically converted to floats as necessary.
result = 3.25 + 4
print(result, 'is', type(result))
7.25 is <class 'float'>
Choose a Type
What type of value (integer, floating point number, or character string) would you use to represent each of the following? Try to come up with more than one good answer for each problem. For example, in # 1, when would counting days with a floating point variable make more sense than using an integer?
- Number of days since the start of the year.
- Time elapsed from the start of the year until now in days.
- Serial number of a piece of lab equipment.
- A lab specimen’s age
- Current population of a city.
- Average population of a city over time.
Solution
The answers to the questions are:
- Integer, since the number of days would lie between 1 and 365.
- Floating point, since fractional days are required
- Character string if serial number contains letters and numbers, otherwise integer if the serial number consists only of numerals
- This will vary! How do you define a specimen’s age? whole days since collection (integer)? date and time (string)?
- Choose floating point to represent population as large aggregates (eg millions), or integer to represent population in units of individuals.
- Floating point number, since an average is likely to have a fractional part.
Key Points
Every value has a type.
Use the built-in function
typeto find the type of a value.Types control what operations can be done on values.
Strings can be added.
Strings have a length.
Must convert numbers to strings or vice versa when operating on them.
Can mix integers and floats freely in operations.
Variables only change value when something is assigned to them.
Built-in Functions and Help
Overview
Teaching: 12 min
Exercises: 0 minQuestions
How can I use built-in functions?
How can I find out what they do?
What kind of errors can occur in programs?
Objectives
Explain the purpose of functions.
Correctly call built-in Python functions.
Correctly nest calls to built-in functions.
Use help to display documentation for built-in functions.
Correctly describe situations in which SyntaxError and NameError occur.
Use comments to add documentation to programs.
# This sentence isn't executed by Python.
adjustment = 0.5   # Neither is this - anything after '#' is ignored.
A function may take zero or more arguments.
- We have seen some functions already — now let’s take a closer look.
- An argument is a value passed into a function.
lentakes exactly one.int,str, andfloatcreate a new value from an existing one.printtakes zero or more.printwith no arguments prints a blank line.- Must always use parentheses, even if they’re empty, so that Python knows a function is being called.
print('before')
print()
print('after')
before

after
Every function returns something.
- Every function call produces some result.
- If the function doesn’t have a useful result to return,
it usually returns the special value
None.Noneis a Python object that stands in anytime there is no value.
Commonly-used built-in functions include max, min, and round.
- Use
maxto find the largest value of one or more values. - Use
minto find the smallest. - Both work on character strings as well as numbers.
- “Larger” and “smaller” use (0-9, A-Z, a-z) to compare letters.
print(max(1, 2, 3))
print(min('a', 'A', '0'))
3
0
Functions may only work for certain (combinations of) arguments.
maxandminmust be given at least one argument.- “Largest of the empty set” is a meaningless question.
- And they must be given things that can meaningfully be compared.
print(max(1, 'a'))
TypeError                                 Traceback (most recent call last)
<ipython-input-52-3f049acf3762> in <module>
----> 1 print(max(1, 'a'))

TypeError: '>' not supported between instances of 'str' and 'int'
Functions may have default values for some arguments.
roundwill round off a floating-point number.- By default, rounds to zero decimal places.
round(3.712)
4
- We can specify the number of decimal places we want.
round(3.712, 1)
3.7
Functions attached to objects are called methods
- Functions take another form that will be common in the pandas episodes.
- Methods have parentheses like functions, but come after the variable.
- Some methods are used for internal Python operations, and are marked with double underlines.
my_string = 'Hello world!'  # creation of a string object

print(len(my_string))       # the len function takes a string as an argument and returns the length of the string

print(my_string.swapcase()) # calling the swapcase method on the my_string object

print(my_string.__len__())  # calling the internal __len__ method on the my_string object, used by len(my_string)
12
hELLO WORLD!
12
- You might even see them chained together. They operate left to right.
print(my_string.isupper())          # Not all the letters are uppercase
print(my_string.upper())            # This capitalizes all the letters

print(my_string.upper().isupper())  # Now all the letters are uppercase
False
HELLO WORLD
True
Use the built-in function help to get help for a function.
- Every built-in function has online documentation.
help(round)
Help on built-in function round in module builtins:

round(number, ndigits=None)
    Round a number to a given precision in decimal digits.

    The return value is an integer if ndigits is omitted or None.  Otherwise
    the return value has the same type as the number.  ndigits may be negative.
The Jupyter Notebook has two ways to get help.
- Option 1: Place the cursor near where the function is invoked in a cell
(i.e., the function name or its parameters),
- Hold down Shift, and press Tab.
- Do this several times to expand the information returned.
- Option 2: Type the function name in a cell with a question mark after it. Then run the cell.
Python reports a syntax error when it can’t understand the source of a program.
- Won’t even try to run the program if it can’t be parsed.
# Forgot to close the quote marks around the string.
name = 'Feng
  File "<ipython-input-56-f42768451d55>", line 2
    name = 'Feng
                ^
SyntaxError: EOL while scanning string literal
# An extra '=' in the assignment.
age = = 52
  File "<ipython-input-57-ccc3df3cf902>", line 2
    age = = 52
          ^
SyntaxError: invalid syntax
- Look more closely at the error message:
print("hello world"
  File "<ipython-input-6-d1cc229bf815>", line 1
    print ("hello world"
                        ^
SyntaxError: unexpected EOF while parsing
- The message indicates a problem on first line of the input (“line 1”).
- In this case the “ipython-input” section of the file name tells us that we are working with input into IPython, the Python interpreter used by the Jupyter Notebook.
- The
-6-part of the filename indicates that the error occurred in cell 6 of our Notebook. - Next is the problematic line of code,
indicating the problem with a
^pointer.
Python reports a runtime error when something goes wrong while a program is executing.
age = 53
remaining = 100 - aege # mis-spelled 'age'
NameError                                 Traceback (most recent call last)
<ipython-input-59-1214fb6c55fc> in <module>
      1 age = 53
----> 2 remaining = 100 - aege # mis-spelled 'age'

NameError: name 'aege' is not defined
- Fix syntax errors by reading the source and runtime errors by tracing execution.
Explore the Python docs!
The official Python documentation is arguably the most complete source of information about the language. It is available in different languages and contains a lot of useful resources. The Built-in Functions page contains a catalogue of all of these functions, including the ones that we’ve covered in this lesson. Some of these are more advanced and unnecessary at the moment, but others are very simple and useful.
Key Points
Use comments to add documentation to programs.
A function may take zero or more arguments.
Commonly-used built-in functions include
max,min, andround.Functions may only work for certain (combinations of) arguments.
Functions may have default values for some arguments.
Use the built-in function
helpto get help for a function.The Jupyter Notebook has two ways to get help.
Every function returns something.
Python reports a syntax error when it can’t understand the source of a program.
Python reports a runtime error when something goes wrong while a program is executing.
Fix syntax errors by reading the source code, and runtime errors by tracing the program’s execution.
Libraries
Overview
Teaching: 6 min
Exercises: 5 minQuestions
How can I use software that other people have written?
How can I find out what that software does?
Objectives
Explain what software libraries are and why programmers create and use them.
Write programs that import and use modules from Python’s standard library.
Find and read documentation for the standard library interactively (in the interpreter) and online.
Most of the power of a programming language is in its libraries.
- A library is a collection of files (called modules) that contains
functions for use by other programs.
- May also contain data values (e.g., numerical constants) and other things.
- Library’s contents are supposed to be related, but there’s no way to enforce that.
- The Python standard library is an extensive suite of modules that comes with Python itself.
- Many additional libraries are available from PyPI (the Python Package Index).
Libraries and modules
A library is a collection of modules, but the terms are often used interchangeably, especially since many libraries only consist of a single module, so don’t worry if you mix them.
A program must import a library module before using it.
- Use
importto load a library module into a program’s memory. - Then refer to things from the module as
module_name.thing_name.- Python uses
.to mean “part of”.
- Python uses
- Using
math, one of the modules in the standard library:
import math

print('pi is', math.pi)
print('cos(pi) is', math.cos(math.pi))
pi is 3.141592653589793
cos(pi) is -1.0
- Have to refer to each item with the module’s name.
math.cos(pi)won’t work: the reference topidoesn’t somehow “inherit” the function’s reference tomath.
Use help to learn about the contents of a library module.
- Works just like help for a function.
help(math)
Help on module math:

NAME
    math

MODULE REFERENCE
    http://docs.python.org/3/library/math

    The following documentation is automatically generated from the Python
    source files.  It may be incomplete, incorrect or include features that
    are considered implementation detail and may vary between Python
    implementations.  When in doubt, consult the module reference at the
    location listed above.

DESCRIPTION
    This module is always available.  It provides access to the
    mathematical functions defined by the C standard.

FUNCTIONS
    acos(x, /)
        Return the arc cosine (measured in radians) of x.
⋮ ⋮ ⋮
Import specific items from a library module to shorten programs.
- Use
from ... import ...to load only specific items from a library module. - Then refer to them directly without library name as prefix.
from math import cos, pi

print('cos(pi) is', cos(pi))
cos(pi) is -1.0
Create an alias for a library module when importing it to shorten programs.
- Use
import ... as ...to give a library a short alias while importing it. - Then refer to items in the library using that shortened name.
import math as m

print('cos(pi) is', m.cos(m.pi))
cos(pi) is -1.0
- Commonly used for libraries that are frequently used or have long names.
- E.g., the
matplotlibplotting library is often aliased asmpl.
- E.g., the
- But can make programs harder to understand, since readers must learn your program’s aliases.
When Is Help Available?
When a colleague of yours types
help(math), Python reports an error:NameError: name 'math' is not definedWhat has your colleague forgotten to do?
Solution
Importing the math module (
import math)
Importing Specific Items
- Fill in the blanks so that the program below prints
90.0.- Do you find this version easier to read than preceding ones?
- Why wouldn’t programmers always use this form of
import?____ math import ____, ____ angle = degrees(pi / 2) print(angle)Solution
from math import degrees, pi
angle = degrees(pi / 2)
print(angle)
Most likely you find this version easier to read since it’s less dense. The main reason not to use this form of import is to avoid name clashes. For instance, you wouldn’t import
degreesthis way if you also wanted to use the namedegreesfor a variable or function of your own. Or if you were to also import a function nameddegreesfrom another library.
Key Points
Most of the power of a programming language is in its libraries.
A program must import a library module in order to use it.
Use
helpto learn about the contents of a library module.Import specific items from a library to shorten programs.
Create an alias for a library when importing it to shorten programs.
Reading Tabular Data into DataFrames
Overview
Teaching: 8 min
Exercises: 7 minQuestions
How can I read tabular data?
Objectives
Import the Pandas library.
Use Pandas to load a simple CSV data set.
Get some basic information about a Pandas DataFrame.
Use the Pandas library to do statistics on tabular data.
- Pandas is a widely-used Python library for statistics, particularly on tabular data.
- Load it with
import pandas as pd. The alias pd is commonly used for Pandas. - Read a Comma Separated Values (CSV) data file with
pd.read_csv.- Argument is the name of the file to be read.
- Assign result to a variable to store the data that was read.
import pandas as pd

data = pd.read_csv('data/gapminder_gdp_oceania.csv')
print(data)
       country  gdpPercap_1952  gdpPercap_1957  gdpPercap_1962  \
0    Australia     10039.59564     10949.64959     12217.22686
1  New Zealand     10556.57566     12247.39532     13175.67800

   gdpPercap_1967  gdpPercap_1972  gdpPercap_1977  gdpPercap_1982  \
0     14526.12465     16788.62948     18334.19751     19477.00928
1     14463.91893     16046.03728     16233.71770     17632.41040

   gdpPercap_1987  gdpPercap_1992  gdpPercap_1997  gdpPercap_2002  \
0     21888.88903     23424.76683     26997.93657     30687.75473
1     19007.19129     18363.32494     21050.41377     23189.80135

   gdpPercap_2007
0     34435.36744
1     25185.00911
- The columns in a dataframe are the observed variables, and the rows are the observations.
- Pandas uses backslash
\to show wrapped lines when output is too wide to fit the screen.
File Not Found
Our lessons store their data files in a
datasub-directory, which is why the path to the file isdata/gapminder_gdp_oceania.csv. If you forget to includedata/, or if you include it but your copy of the file is somewhere else, you will get a runtime error that ends with a line like this:FileNotFoundError: [Errno 2] No such file or directory: 'data/gapminder_gdp_oceania.csv'
Use index_col to specify that a column’s values should be used as row headings.
- Row headings are numbers (0 and 1 in this case).
- Really want to index by country.
- Pass the name of the column to
read_csvas itsindex_colparameter to do this.
data = pd.read_csv('data/gapminder_gdp_oceania.csv', index_col='country')
print(data)
             gdpPercap_1952  gdpPercap_1957  gdpPercap_1962  gdpPercap_1967  \
country
Australia       10039.59564     10949.64959     12217.22686     14526.12465
New Zealand     10556.57566     12247.39532     13175.67800     14463.91893

             gdpPercap_1972  gdpPercap_1977  gdpPercap_1982  gdpPercap_1987  \
country
Australia       16788.62948     18334.19751     19477.00928     21888.88903
New Zealand     16046.03728     16233.71770     17632.41040     19007.19129

             gdpPercap_1992  gdpPercap_1997  gdpPercap_2002  gdpPercap_2007
country
Australia       23424.76683     26997.93657     30687.75473     34435.36744
New Zealand     18363.32494     21050.41377     23189.80135     25185.00911
Use the DataFrame.info() method to find out more about a dataframe.
data.info()
<class 'pandas.core.frame.DataFrame'>
Index: 2 entries, Australia to New Zealand
Data columns (total 12 columns):
gdpPercap_1952    2 non-null float64
gdpPercap_1957    2 non-null float64
gdpPercap_1962    2 non-null float64
gdpPercap_1967    2 non-null float64
gdpPercap_1972    2 non-null float64
gdpPercap_1977    2 non-null float64
gdpPercap_1982    2 non-null float64
gdpPercap_1987    2 non-null float64
gdpPercap_1992    2 non-null float64
gdpPercap_1997    2 non-null float64
gdpPercap_2002    2 non-null float64
gdpPercap_2007    2 non-null float64
dtypes: float64(12)
memory usage: 208.0+ bytes
- This is a
DataFrame - Two rows named
'Australia'and'New Zealand' - Twelve columns, each of which has two actual 64-bit floating point values.
- We will talk later about null values, which are used to represent missing observations.
- Uses 208 bytes of memory.
The DataFrame.columns variable stores information about the dataframe’s columns.
- Note that this is data, not a method. (It doesn’t have parentheses.)
- Like
math.pi. - So do not use
()to try to call it.
- Like
- Called a member variable, or just member.
print(data.columns)
Index(['gdpPercap_1952', 'gdpPercap_1957', 'gdpPercap_1962', 'gdpPercap_1967',
       'gdpPercap_1972', 'gdpPercap_1977', 'gdpPercap_1982', 'gdpPercap_1987',
       'gdpPercap_1992', 'gdpPercap_1997', 'gdpPercap_2002', 'gdpPercap_2007'],
      dtype='object')
Use DataFrame.T to transpose a dataframe.
- Sometimes want to treat columns as rows and vice versa.
- Transpose (written
.T) doesn’t copy the data, just changes the program’s view of it. - Like
columns, it is a member variable.
print(data.T)
country           Australia  New Zealand
gdpPercap_1952  10039.59564  10556.57566
gdpPercap_1957  10949.64959  12247.39532
gdpPercap_1962  12217.22686  13175.67800
gdpPercap_1967  14526.12465  14463.91893
gdpPercap_1972  16788.62948  16046.03728
gdpPercap_1977  18334.19751  16233.71770
gdpPercap_1982  19477.00928  17632.41040
gdpPercap_1987  21888.88903  19007.19129
gdpPercap_1992  23424.76683  18363.32494
gdpPercap_1997  26997.93657  21050.41377
gdpPercap_2002  30687.75473  23189.80135
gdpPercap_2007  34435.36744  25185.00911
Use DataFrame.describe() to get summary statistics about data.
DataFrame.describe() gets the summary statistics of the columns.
print(data.describe())
       gdpPercap_1952  gdpPercap_1957  gdpPercap_1962  gdpPercap_1967  \
count        2.000000        2.000000        2.000000        2.000000
mean     10298.085650    11598.522455    12696.452430    14495.021790
std        365.560078      917.644806      677.727301       43.986086
min      10039.595640    10949.649590    12217.226860    14463.918930
25%      10168.840645    11274.086022    12456.839645    14479.470360
50%      10298.085650    11598.522455    12696.452430    14495.021790
75%      10427.330655    11922.958888    12936.065215    14510.573220
max      10556.575660    12247.395320    13175.678000    14526.124650

       gdpPercap_1972  gdpPercap_1977  gdpPercap_1982  gdpPercap_1987  \
count         2.00000        2.000000        2.000000        2.000000
mean      16417.33338    17283.957605    18554.709840    20448.040160
std         525.09198     1485.263517     1304.328377     2037.668013
min       16046.03728    16233.717700    17632.410400    19007.191290
25%       16231.68533    16758.837652    18093.560120    19727.615725
50%       16417.33338    17283.957605    18554.709840    20448.040160
75%       16602.98143    17809.077557    19015.859560    21168.464595
max       16788.62948    18334.197510    19477.009280    21888.889030

       gdpPercap_1992  gdpPercap_1997  gdpPercap_2002  gdpPercap_2007
count        2.000000        2.000000        2.000000        2.000000
mean     20894.045885    24024.175170    26938.778040    29810.188275
std       3578.979883     4205.533703     5301.853680     6540.991104
min      18363.324940    21050.413770    23189.801350    25185.009110
25%      19628.685413    22537.294470    25064.289695    27497.598692
50%      20894.045885    24024.175170    26938.778040    29810.188275
75%      22159.406358    25511.055870    28813.266385    32122.777857
max      23424.766830    26997.936570    30687.754730    34435.367440
- Not particularly useful with just two records, but very helpful when there are thousands.
Reading Other Data
Read the data in
gapminder_gdp_americas.csv(which should be in the same directory asgapminder_gdp_oceania.csv) into a variable calledamericasand display its summary statistics.Solution
To read in a CSV, we use
pd.read_csvand pass the filename'data/gapminder_gdp_americas.csv'to it. We also once again pass the column name'country'to the parameterindex_colin order to index by country. The summary statistics can be displayed with theDataFrame.describe()method.americas = pd.read_csv('data/gapminder_gdp_americas.csv', index_col='country') americas.describe()
Reading Files in Other Directories
The data for your current project is stored in a file called
microbes.csv, which is located in a folder calledfield_data. You are doing analysis in a notebook calledanalysis.ipynbin a sibling folder calledthesis:your_home_directory +-- field_data/ | +-- microbes.csv +-- thesis/ +-- analysis.ipynbWhat value(s) should you pass to
read_csvto readmicrobes.csvinanalysis.ipynb?Solution
We need to specify the path to the file of interest in the call to
pd.read_csv. We first need to ‘jump’ out of the folderthesisusing ‘../’ and then into the folderfield_datausing ‘field_data/’. Then we can specify the filename `microbes.csv. The result is as follows:data_microbes = pd.read_csv('../field_data/microbes.csv')
Writing Data
As well as the
read_csvfunction for reading data from a file, Pandas provides ato_csvfunction to write dataframes to files. Applying what you’ve learned about reading from files, write one of your dataframes to a file calledprocessed.csv. You can usehelpto get information on how to useto_csv.Solution
In order to write the DataFrame
americasto a file calledprocessed.csv, execute the following command:americas.to_csv('processed.csv')For help on
to_csv, you could execute, for example:help(americas.to_csv)Note that
help(to_csv)throws an error! This is a subtlety and is due to the fact thatto_csvis NOT a function in and of itself and the actual call isamericas.to_csv.
Key Points
Use the Pandas library to get basic statistics out of tabular data.
Use
index_colto specify that a column’s values should be used as row headings.Use
DataFrame.infoto find out more about a dataframe.The
DataFrame.columnsvariable stores information about the dataframe’s columns.Use
DataFrame.Tto transpose a dataframe.Use
DataFrame.describeto get summary statistics about data.
Pandas DataFrames
Overview
Teaching: 12 min
Exercises: 13 minQuestions
How can I do statistical analysis of tabular data?
Objectives
Select individual values from a Pandas dataframe.
Select entire rows or entire columns from a dataframe.
Select a subset of both rows and columns from a dataframe in a single operation.
Select a subset of a dataframe by a single Boolean criterion.
Selecting values
To access a value at the position [i,j] of a DataFrame, we have two options, depending on
what is the meaning of i in use.
Remember that a DataFrame provides an index as a way to identify the rows of the table;
a row, then, has a position inside the table as well as a label, which
uniquely identifies its entry in the DataFrame.
Use DataFrame.iloc[..., ...] to select values by their (entry) position
- Can specify location by numerical index analogously to 2D version of character selection in strings.
import pandas as pd
data = pd.read_csv('data/gapminder_gdp_europe.csv', index_col='country')
print(data.iloc[0, 0])
1601.056136
Use DataFrame.loc[..., ...] to select values by their (entry) label.
- Can specify location by row name analogously to 2D version of dictionary keys.
print(data.loc["Albania", "gdpPercap_1952"])
1601.056136
Use : on its own to mean all columns or all rows.
- Just like Python’s usual slicing notation.
print(data.loc["Albania", :])
gdpPercap_1952    1601.056136
gdpPercap_1957    1942.284244
gdpPercap_1962    2312.888958
gdpPercap_1967    2760.196931
gdpPercap_1972    3313.422188
gdpPercap_1977    3533.003910
gdpPercap_1982    3630.880722
gdpPercap_1987    3738.932735
gdpPercap_1992    2497.437901
gdpPercap_1997    3193.054604
gdpPercap_2002    4604.211737
gdpPercap_2007    5937.029526
Name: Albania, dtype: float64
- Would get the same result printing
data.loc["Albania"](without a second index).
print(data.loc[:, "gdpPercap_1952"])
country
Albania                    1601.056136
Austria                    6137.076492
Belgium                    8343.105127
⋮ ⋮ ⋮
Switzerland               14734.232750
Turkey                     1969.100980
United Kingdom             9979.508487
Name: gdpPercap_1952, dtype: float64
- Would get the same result printing
data["gdpPercap_1952"]
Select multiple columns or rows using DataFrame.loc and a named slice.
print(data.loc['Italy':'Poland', 'gdpPercap_1962':'gdpPercap_1972'])
             gdpPercap_1962  gdpPercap_1967  gdpPercap_1972
country
Italy           8243.582340    10022.401310    12269.273780
Montenegro      4649.593785     5907.850937     7778.414017
Netherlands    12790.849560    15363.251360    18794.745670
Norway         13450.401510    16361.876470    18965.055510
Poland          5338.752143     6557.152776     8006.506993
In the above code, we discover that slicing using loc is inclusive at both
ends, which differs from slicing using iloc, where slicing indicates
everything up to but not including the final index.
Result of slicing can be used in further operations.
- Usually don’t just print a slice.
- All the statistical operators that work on entire dataframes work the same way on slices.
- E.g., calculate max of a slice.
print(data.loc['Italy':'Poland', 'gdpPercap_1962':'gdpPercap_1972'].max())
gdpPercap_1962    13450.40151
gdpPercap_1967    16361.87647
gdpPercap_1972    18965.05551
dtype: float64
print(data.loc['Italy':'Poland', 'gdpPercap_1962':'gdpPercap_1972'].min())
gdpPercap_1962    4649.593785
gdpPercap_1967    5907.850937
gdpPercap_1972    7778.414017
dtype: float64
Use comparisons to select data based on value.
- Comparison is applied element by element.
- Returns a similarly-shaped dataframe of
TrueandFalse.
# Use a subset of data to keep output readable.
subset = data.loc['Italy':'Poland', 'gdpPercap_1962':'gdpPercap_1972']
print('Subset of data:\n', subset)

# Which values were greater than 10000 ?
print('\nWhere are values large?\n', subset > 10000)
Subset of data:
             gdpPercap_1962  gdpPercap_1967  gdpPercap_1972
country
Italy           8243.582340    10022.401310    12269.273780
Montenegro      4649.593785     5907.850937     7778.414017
Netherlands    12790.849560    15363.251360    18794.745670
Norway         13450.401510    16361.876470    18965.055510
Poland          5338.752143     6557.152776     8006.506993

Where are values large?
            gdpPercap_1962 gdpPercap_1967 gdpPercap_1972
country
Italy                False           True           True
Montenegro           False          False          False
Netherlands           True           True           True
Norway                True           True           True
Poland               False          False          False
Select values or NaN using a Boolean mask.
- A frame full of Booleans is sometimes called a mask because of how it can be used.
mask = subset > 10000
print(subset[mask])
             gdpPercap_1962  gdpPercap_1967  gdpPercap_1972
country
Italy                   NaN     10022.40131     12269.27378
Montenegro              NaN             NaN             NaN
Netherlands     12790.84956     15363.25136     18794.74567
Norway          13450.40151     16361.87647     18965.05551
Poland                  NaN             NaN             NaN
- Get the value where the mask is true, and NaN (Not a Number) where it is false.
- Useful because NaNs are ignored by operations like max, min, average, etc.
print(subset[subset > 10000].describe())
       gdpPercap_1962  gdpPercap_1967  gdpPercap_1972
count        2.000000        3.000000        3.000000
mean     13120.625535    13915.843047    16676.358320
std        466.373656     3408.589070     3817.597015
min      12790.849560    10022.401310    12269.273780
25%      12955.737547    12692.826335    15532.009725
50%      13120.625535    15363.251360    18794.745670
75%      13285.513523    15862.563915    18879.900590
max      13450.401510    16361.876470    18965.055510
Selection of Individual Values
Assume Pandas has been imported into your notebook and the Gapminder GDP data for Europe has been loaded:
import pandas as pd

df = pd.read_csv('data/gapminder_gdp_europe.csv', index_col='country')
Write an expression to find the Per Capita GDP of Serbia in 2007.
Solution
The selection can be done by using the labels for both the row (“Serbia”) and the column (“gdpPercap_2007”):
print(df.loc['Serbia', 'gdpPercap_2007'])The output is
9786.534714
Extent of Slicing
- Do the two statements below produce the same output?
- Based on this, what rule governs what is included (or not) in numerical slices and named slices in Pandas?
print(df.iloc[0:2, 0:2])
print(df.loc['Albania':'Belgium', 'gdpPercap_1952':'gdpPercap_1962'])
Solution
No, they do not produce the same output! The output of the first statement is:
        gdpPercap_1952  gdpPercap_1957
country
Albania     1601.056136     1942.284244
Austria     6137.076492     8842.598030
The second statement gives:
        gdpPercap_1952  gdpPercap_1957  gdpPercap_1962
country
Albania     1601.056136     1942.284244     2312.888958
Austria     6137.076492     8842.598030    10750.721110
Belgium     8343.105127     9714.960623    10991.206760
Clearly, the second statement produces an additional column and an additional row compared to the first statement.
What conclusion can we draw? We see that a numerical slice, 0:2, omits the final index (i.e. index 2) in the range provided, while a named slice, ‘gdpPercap_1952’:’gdpPercap_1962’, includes the final element.
Practice with Selection
Assume Pandas has been imported and the Gapminder GDP data for Europe has been loaded. Write an expression to select each of the following:
- GDP per capita for each country in 1982.
- GDP per capita for Denmark for each year.
- GDP per capita for each country in 2007 as a ratio to the GDP per capita for that country in 1952.
Solution
1:
data['gdpPercap_1982']2:
data.loc['Denmark',:]3:
data['gdpPercap_2007']/data['gdpPercap_1952']
Exploring available methods using the
dir()functionPython includes a
dir()function that can be used to display all of the available methods (functions) that are built into a data object. In Episode 4, we used some methods with a string. But we can see many more are available by usingdir():my_string = 'Hello world!' # creation of a string object dir(my_string)This command returns:
['__add__',
...
'__subclasshook__',
'capitalize',
'casefold',
'center',
...
'upper',
'zfill']
You can use
help()or Shift+Tab to get more information about what these methods do.Assume Pandas has been imported and the Gapminder GDP data for Europe has been loaded as
data. Then, usedir()to find the function that prints out the median per-capita GDP across all European countries for each year that information is available.Solution
Among many choices,
dir()lists themedian()function as a possibility. Thus,data.median()
Key Points
Use
DataFrame.iloc[..., ...]to select values by integer location.Use
:on its own to mean all columns or all rows.Select multiple columns or rows using
DataFrame.locand a named slice.Result of slicing can be used in further operations.
Use comparisons to select data based on value.
Select values or NaN using a Boolean mask.
Break
Overview
Teaching: 0 min
Exercises: 0 minQuestions
Objectives
Reflection exercise
Reflect on and discuss the following:
- What are the different kinds of errors Python will report?
- Did the code always produce the results you expected? If not, why?
- Is there something we can do to prevent errors when we write code?
Key Points
Plotting
Overview
Teaching: 15 min
Exercises: 15 minQuestions
How can I plot my data?
How can I save my plot for publishing?
Objectives
Create a time series plot showing a single data set.
Create a scatter plot showing relationship between two data sets.
matplotlib is the most widely used scientific plotting library in Python.
- Commonly use a sub-library called
matplotlib.pyplot. - The Jupyter Notebook will render plots inline by default.
import matplotlib.pyplot as plt
- Simple plots are then (fairly) simple to create.
time = [0, 1, 2, 3]
position = [0, 100, 200, 300]

plt.plot(time, position)
plt.xlabel('Time (hr)')
plt.ylabel('Position (km)')

Display All Open Figures
In our Jupyter Notebook example, running the cell should generate the figure directly below the code. The figure is also included in the Notebook document for future viewing. However, other Python environments like an interactive Python session started from a terminal or a Python script executed via the command line require an additional command to display the figure.
Instruct
matplotlibto show a figure:plt.show()This command can also be used within a Notebook - for instance, to display multiple figures if several are created by a single cell.
Plot data directly from a Pandas dataframe.
- We can also plot Pandas dataframes.
- This implicitly uses
matplotlib.pyplot. - Before plotting, we convert the column headings from a
stringtointegerdata type, since they represent numerical values
import pandas as pd

data = pd.read_csv('data/gapminder_gdp_oceania.csv', index_col='country')

# Extract year from last 4 characters of each column name
# The current column names are structured as 'gdpPercap_(year)',
# so we want to keep the (year) part only for clarity when plotting GDP vs. years
# To do this we use strip(), which removes from the string the characters stated in the argument
# This method works on strings, so we call str before strip()

years = data.columns.str.strip('gdpPercap_')

# Convert year values to integers, saving results back to dataframe

data.columns = years.astype(int)

data.loc['Australia'].plot()

Select and transform data, then plot it.
- By default,
DataFrame.plotplots with the rows as the X axis. - We can transpose the data in order to plot multiple series.
data.T.plot()
plt.ylabel('GDP per capita')

Many styles of plot are available.
- For example, do a bar plot using a fancier style.
plt.style.use('ggplot')
data.T.plot(kind='bar')
plt.ylabel('GDP per capita')

Data can also be plotted by calling the matplotlib plot function directly.
- The command is
plt.plot(x, y) - The color and format of markers can also be specified as an additional optional argument e.g.,
b-is a blue line,g--is a green dashed line.
Get Australia data from dataframe
years = data.columns
gdp_australia = data.loc['Australia']

plt.plot(years, gdp_australia, 'g--')

Can plot many sets of data together.
# Select two countries' worth of data.
gdp_australia = data.loc['Australia']
gdp_nz = data.loc['New Zealand']

# Plot with differently-colored markers.
plt.plot(years, gdp_australia, 'b-', label='Australia')
plt.plot(years, gdp_nz, 'g-', label='New Zealand')

# Create legend.
plt.legend(loc='upper left')
plt.xlabel('Year')
plt.ylabel('GDP per capita ($)')
Adding a Legend
Often when plotting multiple datasets on the same figure it is desirable to have a legend describing the data.
This can be done in
matplotlibin two stages:
- Provide a label for each dataset in the figure:
plt.plot(years, gdp_australia, label='Australia')
plt.plot(years, gdp_nz, label='New Zealand')
- Instruct
matplotlibto create the legend.plt.legend()By default matplotlib will attempt to place the legend in a suitable position. If you would rather specify a position this can be done with the
loc=argument, e.g to place the legend in the upper left corner of the plot, specifyloc='upper left'

- Plot a scatter plot correlating the GDP of Australia and New Zealand
- Use either
plt.scatterorDataFrame.plot.scatter
plt.scatter(gdp_australia, gdp_nz)

data.T.plot.scatter(x = 'Australia', y = 'New Zealand')

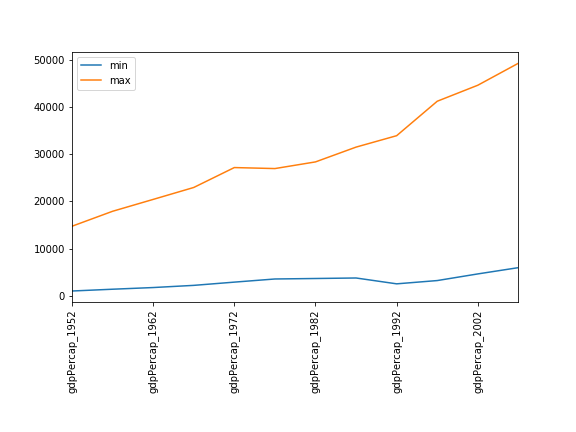
Minima and Maxima
Fill in the blanks below to plot the minimum GDP per capita over time for all the countries in Europe. Modify it again to plot the maximum GDP per capita over time for Europe.
data_europe = pd.read_csv('data/gapminder_gdp_europe.csv', index_col='country')
data_europe.____.plot(label='min')
data_europe.____
plt.legend(loc='best')
plt.xticks(rotation=90)
Solution
data_europe = pd.read_csv('data/gapminder_gdp_europe.csv', index_col='country')
data_europe.min().plot(label='min')
data_europe.max().plot(label='max')
plt.legend(loc='best')
plt.xticks(rotation=90)
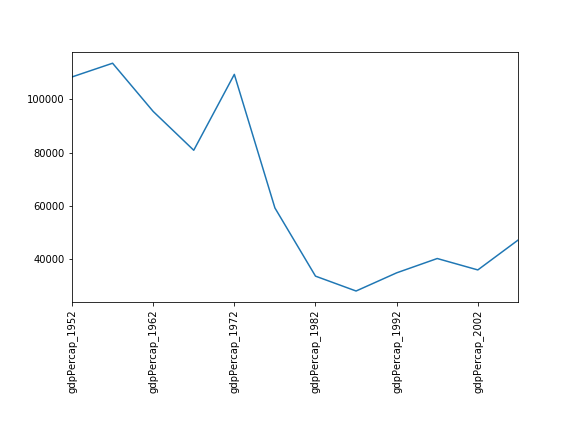
Correlations
Modify the example in the notes to create a scatter plot showing the relationship between the minimum and maximum GDP per capita among the countries in Asia for each year in the data set. What relationship do you see (if any)?
Solution
data_asia = pd.read_csv('data/gapminder_gdp_asia.csv', index_col='country')
data_asia.describe().T.plot(kind='scatter', x='min', y='max')
No particular correlations can be seen between the minimum and maximum gdp values year on year. It seems the fortunes of asian countries do not rise and fall together.
You might note that the variability in the maximum is much higher than that of the minimum. Take a look at the maximum and the max indexes:
data_asia = pd.read_csv('data/gapminder_gdp_asia.csv', index_col='country')
data_asia.max().plot()
print(data_asia.idxmax())
print(data_asia.idxmin())
Solution
Seems the variability in this value is due to a sharp drop after 1972. Some geopolitics at play perhaps? Given the dominance of oil producing countries, maybe the Brent crude index would make an interesting comparison? Whilst Myanmar consistently has the lowest gdp, the highest gdb nation has varied more notably.

More Correlations
This short program creates a plot showing the correlation between GDP and life expectancy for 2007, normalizing marker size by population:
data_all = pd.read_csv('data/gapminder_all.csv', index_col='country')
data_all.plot(kind='scatter', x='gdpPercap_2007', y='lifeExp_2007',
              s=data_all['pop_2007']/1e6)
Using online help and other resources, explain what each argument to
plotdoes.Solution
A good place to look is the documentation for the plot function - help(data_all.plot).
kind - As seen already this determines the kind of plot to be drawn.
x and y - A column name or index that determines what data will be placed on the x and y axes of the plot
s - Details for this can be found in the documentation of plt.scatter. A single number or one value for each data point. Determines the size of the plotted points.

Saving your plot to a file
If you are satisfied with the plot you see you may want to save it to a file, perhaps to include it in a publication. There is a function in the matplotlib.pyplot module that accomplishes this: savefig. Calling this function, e.g. with
plt.savefig('my_figure.png')will save the current figure to the file
my_figure.png. The file format will automatically be deduced from the file name extension (other formats are pdf, ps, eps and svg).Note that functions in
pltrefer to a global figure variable and after a figure has been displayed to the screen (e.g. withplt.show) matplotlib will make this variable refer to a new empty figure. Therefore, make sure you callplt.savefigbefore the plot is displayed to the screen, otherwise you may find a file with an empty plot.When using dataframes, data is often generated and plotted to screen in one line, and
plt.savefigseems not to be a possible approach. One possibility to save the figure to file is then to
- save a reference to the current figure in a local variable (with
plt.gcf)- call the
savefigclass method from that variable.fig = plt.gcf() # get current figure data.plot(kind='bar') fig.savefig('my_figure.png')
Making your plots accessible
Whenever you are generating plots to go into a paper or a presentation, there are a few things you can do to make sure that everyone can understand your plots.
- Always make sure your text is large enough to read. Use the
fontsizeparameter inxlabel,ylabel,title, andlegend, andtick_paramswithlabelsizeto increase the text size of the numbers on your axes.- Similarly, you should make your graph elements easy to see. Use
sto increase the size of your scatterplot markers andlinewidthto increase the sizes of your plot lines.- Using color (and nothing else) to distinguish between different plot elements will make your plots unreadable to anyone who is colorblind, or who happens to have a black-and-white office printer. For lines, the
linestyleparameter lets you use different types of lines. For scatterplots,markerlets you change the shape of your points. If you’re unsure about your colors, you can use Coblis or Color Oracle to simulate what your plots would look like to those with colorblindness.
Key Points
matplotlibis the most widely used scientific plotting library in Python.Plot data directly from a Pandas dataframe.
Select and transform data, then plot it.
Many styles of plot are available: see the Python Graph Gallery for more options.
Can plot many sets of data together.
Lists
Overview
Teaching: 10 min
Exercises: 10 minQuestions
How can I store multiple values?
Objectives
Explain why programs need collections of values.
Write programs that create flat lists, index them, slice them, and modify them through assignment and method calls.
A list stores many values in a single structure.
- Doing calculations with a hundred variables called
pressure_001,pressure_002, etc., would be at least as slow as doing them by hand. - Use a list to store many values together.
- Contained within square brackets
[...]. - Values separated by commas
,.
- Contained within square brackets
- Use
lento find out how many values are in a list.
pressures = [0.273, 0.275, 0.277, 0.275, 0.276]
print('pressures:', pressures)
print('length:', len(pressures))
pressures: [0.273, 0.275, 0.277, 0.275, 0.276]
length: 5
Use an item’s index to fetch it from a list.
- Just like strings.
print('zeroth item of pressures:', pressures[0])
print('fourth item of pressures:', pressures[4])
zeroth item of pressures: 0.273
fourth item of pressures: 0.276
Lists’ values can be replaced by assigning to them.
- Use an index expression on the left of assignment to replace a value.
pressures[0] = 0.265
print('pressures is now:', pressures)
pressures is now: [0.265, 0.275, 0.277, 0.275, 0.276]
Appending items to a list lengthens it.
- Use
list_name.appendto add items to the end of a list.
primes = [2, 3, 5]
print('primes is initially:', primes)
primes.append(7)
print('primes has become:', primes)
primes is initially: [2, 3, 5]
primes has become: [2, 3, 5, 7]
appendis a method of lists.- Like a function, but tied to a particular object.
- Use
object_name.method_nameto call methods.- Deliberately resembles the way we refer to things in a library.
- We will meet other methods of lists as we go along.
- Use
help(list)for a preview.
- Use
extendis similar toappend, but it allows you to combine two lists. For example:
teen_primes = [11, 13, 17, 19]
middle_aged_primes = [37, 41, 43, 47]
print('primes is currently:', primes)
primes.extend(teen_primes)
print('primes has now become:', primes)
primes.append(middle_aged_primes)
print('primes has finally become:', primes)
primes is currently: [2, 3, 5, 7]
primes has now become: [2, 3, 5, 7, 11, 13, 17, 19]
primes has finally become: [2, 3, 5, 7, 11, 13, 17, 19, [37, 41, 43, 47]]
Note that while extend maintains the “flat” structure of the list, appending a list to a list makes the result
two-dimensional - the last element in primes is a list, not an integer.
Use del to remove items from a list entirely.
- We use
del list_name[index]to remove an element from a list (in the example, 9 is not a prime number) and thus shorten it. delis not a function or a method, but a statement in the language.
primes = [2, 3, 5, 7, 9]
print('primes before removing last item:', primes)
del primes[4]
print('primes after removing last item:', primes)
primes before removing last item: [2, 3, 5, 7, 9]
primes after removing last item: [2, 3, 5, 7]
The empty list contains no values.
- Use
[]on its own to represent a list that doesn’t contain any values.- “The zero of lists.”
- Helpful as a starting point for collecting values (which we will see in the next episode).
Lists may contain values of different types.
- A single list may contain numbers, strings, and anything else.
goals = [1, 'Create lists.', 2, 'Extract items from lists.', 3, 'Modify lists.']
Character strings can be indexed like lists.
- Get single characters from a character string using indexes in square brackets.
element = 'carbon'
print('zeroth character:', element[0])
print('third character:', element[3])
zeroth character: c
third character: b
Character strings are immutable.
- Cannot change the characters in a string after it has been created.
- Immutable: can’t be changed after creation.
- In contrast, lists are mutable: they can be modified in place.
- Python considers the string to be a single value with parts, not a collection of values.
element[0] = 'C'
TypeError: 'str' object does not support item assignment
- Lists and character strings are both collections.
Indexing beyond the end of the collection is an error.
- Python reports an
IndexErrorif we attempt to access a value that doesn’t exist.- This is a kind of runtime error.
- Cannot be detected as the code is parsed because the index might be calculated based on data.
print('99th element of element is:', element[99])
IndexError: string index out of range
Fill in the Blanks
Fill in the blanks so that the program below produces the output shown.
values = ____
values.____(1)
values.____(3)
values.____(5)
print('first time:', values)
values = values[____]
print('second time:', values)
first time: [1, 3, 5] second time: [3, 5]Solution
values = []
values.append(1)
values.append(3)
values.append(5)
print('first time:', values)
values = values[1:]
print('second time:', values)
How Large is a Slice?
If ‘low’ and ‘high’ are both non-negative integers, how long is the list
values[low:high]?Solution
The list
values[low:high]hashigh - lowelements. For example,values[1:4]has the 3 elementsvalues[1],values[2], andvalues[3]. Note that the expression will only work ifhighis less than the total length of the listvalues.
From Strings to Lists and Back
Given this:
print('string to list:', list('tin'))
print('list to string:', ''.join(['g', 'o', 'l', 'd']))
string to list: ['t', 'i', 'n'] list to string: gold
- What does
list('some string')do?- What does
'-'.join(['x', 'y', 'z'])generate?Solution
list('some string')converts a string into a list containing all of its characters.joinreturns a string that is the concatenation of each string element in the list and adds the separator between each element in the list. This results inx-y-z. The separator between the elements is the string that provides this method.
Working With the End
What does the following program print?
element = 'helium'
print(element[-1])
- How does Python interpret a negative index?
- If a list or string has N elements, what is the most negative index that can safely be used with it, and what location does that index represent?
- If
valuesis a list, what doesdel values[-1]do?- How can you display all elements but the last one without changing
values? (Hint: you will need to combine slicing and negative indexing.)Solution
The program prints
m.
- Python interprets a negative index as starting from the end (as opposed to starting from the beginning). The last element is
-1.- The last index that can safely be used with a list of N elements is element
-N, which represents the first element.del values[-1]removes the last element from the list.values[:-1]
Stepping Through a List
What does the following program print?
element = 'fluorine'
print(element[::2])
print(element[::-1])
- If we write a slice as
low:high:stride, what doesstridedo?- What expression would select all of the even-numbered items from a collection?
Solution
The program prints
furn
eniroulf
strideis the step size of the slice.- The slice
1::2selects all even-numbered items from a collection: it starts with element1(which is the second element, since indexing starts at0), goes on until the end (since noendis given), and uses a step size of2(i.e., selects every second element).
Slice Bounds
What does the following program print?
element = 'lithium'
print(element[0:20])
print(element[-1:3])
Solution
lithiumThe first statement prints the whole string, since the slice goes beyond the total length of the string. The second statement returns an empty string, because the slice goes “out of bounds” of the string.
Sort and Sorted
What do these two programs print? In simple terms, explain the difference between
sorted(letters)andletters.sort().# Program A letters = list('gold') result = sorted(letters) print('letters is', letters, 'and result is', result)# Program B letters = list('gold') result = letters.sort() print('letters is', letters, 'and result is', result)Solution
Program A prints
letters is ['g', 'o', 'l', 'd'] and result is ['d', 'g', 'l', 'o']Program B prints
letters is ['d', 'g', 'l', 'o'] and result is None
sorted(letters)returns a sorted copy of the listletters(the original listlettersremains unchanged), whileletters.sort()sorts the listlettersin-place and does not return anything.
Copying (or Not)
What do these two programs print? In simple terms, explain the difference between
new = oldandnew = old[:].# Program A old = list('gold') new = old # simple assignment new[0] = 'D' print('new is', new, 'and old is', old)# Program B old = list('gold') new = old[:] # assigning a slice new[0] = 'D' print('new is', new, 'and old is', old)Solution
Program A prints
new is ['D', 'o', 'l', 'd'] and old is ['D', 'o', 'l', 'd']Program B prints
new is ['D', 'o', 'l', 'd'] and old is ['g', 'o', 'l', 'd']
new = oldmakesnewa reference to the listold;newandoldpoint towards the same object.
new = old[:]however creates a new list objectnewcontaining all elements from the listold;newandoldare different objects.
Key Points
A list stores many values in a single structure.
Use an item’s index to fetch it from a list.
Lists’ values can be replaced by assigning to them.
Appending items to a list lengthens it.
Use
delto remove items from a list entirely.The empty list contains no values.
Lists may contain values of different types.
Character strings can be indexed like lists.
Character strings are immutable.
Indexing beyond the end of the collection is an error.
For Loops
Overview
Teaching: 10 min
Exercises: 15 minQuestions
How can I make a program do many things?
Objectives
Explain what for loops are normally used for.
Trace the execution of a simple (unnested) loop and correctly state the values of variables in each iteration.
Write for loops that use the Accumulator pattern to aggregate values.
A for loop executes commands once for each value in a collection.
- Doing calculations on the values in a list one by one
is as painful as working with
pressure_001,pressure_002, etc. - A for loop tells Python to execute some statements once for each value in a list, a character string, or some other collection.
- “for each thing in this group, do these operations”
for number in [2, 3, 5]:
    print(number)
- This
forloop is equivalent to:
print(2)
print(3)
print(5)
- And the
forloop’s output is:
2
3
5
A for loop is made up of a collection, a loop variable, and a body.
for number in [2, 3, 5]:
    print(number)
- The collection,
[2, 3, 5], is what the loop is being run on. - The body,
print(number), specifies what to do for each value in the collection. - The loop variable,
number, is what changes for each iteration of the loop.- The “current thing”.
The first line of the for loop must end with a colon, and the body must be indented.
- The colon at the end of the first line signals the start of a block of statements.
- Python uses indentation rather than
{}orbegin/endto show nesting.- Any consistent indentation is legal, but almost everyone uses four spaces.
for number in [2, 3, 5]:
print(number)
IndentationError: expected an indented block
- Indentation is always meaningful in Python.
firstName = "Jon"
  lastName = "Smith"
  File "<ipython-input-7-f65f2962bf9c>", line 2
    lastName = "Smith"
    ^
IndentationError: unexpected indent
- This error can be fixed by removing the extra spaces at the beginning of the second line.
Loop variables can be called anything.
- As with all variables, loop variables are:
- Created on demand.
- Meaningless: their names can be anything at all.
for kitten in [2, 3, 5]:
    print(kitten)
The body of a loop can contain many statements.
- But no loop should be more than a few lines long.
- Hard for human beings to keep larger chunks of code in mind.
primes = [2, 3, 5]
for p in primes:
    squared = p ** 2
    cubed = p ** 3
    print(p, squared, cubed)
2 4 8
3 9 27
5 25 125
Use range to iterate over a sequence of numbers.
- The built-in function
rangeproduces a sequence of numbers.- Not a list: the numbers are produced on demand to make looping over large ranges more efficient.
range(N)is the numbers 0..N-1- Exactly the legal indices of a list or character string of length N
print('a range is not a list: range(0, 3)')
for number in range(0, 3):
    print(number)
a range is not a list: range(0, 3)
0
1
2
The Accumulator pattern turns many values into one.
- A common pattern in programs is to:
- Initialize an accumulator variable to zero, the empty string, or the empty list.
- Update the variable with values from a collection.
# Sum the first 10 integers.
total = 0
for number in range(10):
   total = total + (number + 1)
print(total)
55
- Read
total = total + (number + 1)as:- Add 1 to the current value of the loop variable
number. - Add that to the current value of the accumulator variable
total. - Assign that to
total, replacing the current value.
- Add 1 to the current value of the loop variable
- We have to add
number + 1becauserangeproduces 0..9, not 1..10.
Classifying Errors
Is an indentation error a syntax error or a runtime error?
Solution
An IndentationError is a syntax error. Programs with syntax errors cannot be started. A program with a runtime error will start but an error will be thrown under certain conditions.
Tracing Execution
Create a table showing the numbers of the lines that are executed when this program runs, and the values of the variables after each line is executed.
total = 0
for char in "tin":
    total = total + 1
Solution
Line no Variables 1 total = 0 2 total = 0 char = ‘t’ 3 total = 1 char = ‘t’ 2 total = 1 char = ‘i’ 3 total = 2 char = ‘i’ 2 total = 2 char = ‘n’ 3 total = 3 char = ‘n’
Reversing a String
Fill in the blanks in the program below so that it prints “nit” (the reverse of the original character string “tin”).
original = "tin"
result = ____
for char in original:
    result = ____
print(result)
Solution
original = "tin"
result = ""
for char in original:
    result = char + result
print(result)
Practice Accumulating
Fill in the blanks in each of the programs below to produce the indicated result.
# Total length of the strings in the list: ["red", "green", "blue"] => 12
total = 0
for word in ["red", "green", "blue"]:
    ____ = ____ + len(word)
print(total)
Solution
total = 0
for word in ["red", "green", "blue"]:
    total = total + len(word)
print(total)
# List of word lengths: ["red", "green", "blue"] => [3, 5, 4] lengths = ____ for word in ["red", "green", "blue"]: lengths.____(____) print(lengths)Solution
lengths = []
for word in ["red", "green", "blue"]:
    lengths.append(len(word))
print(lengths)
# Concatenate all words: ["red", "green", "blue"] => "redgreenblue" words = ["red", "green", "blue"] result = ____ for ____ in ____: ____ print(result)Solution
words = ["red", "green", "blue"]
result = ""
for word in words:
    result = result + word
print(result)
Create an acronym: Starting from the list
["red", "green", "blue"], create the acronym"RGB"using a for loop.Hint: You may need to use a string method to properly format the acronym.
Solution
acronym = ""
for word in ["red", "green", "blue"]:
    acronym = acronym + word[0].upper()
print(acronym)
Cumulative Sum
Reorder and properly indent the lines of code below so that they print a list with the cumulative sum of data. The result should be
[1, 3, 5, 10].cumulative.append(total) for number in data: cumulative = [] total += number total = 0 print(cumulative) data = [1,2,2,5]Solution
total = 0
data = [1,2,2,5]
cumulative = []
for number in data:
    total += number
    cumulative.append(total)
print(cumulative)
Identifying Variable Name Errors
- Read the code below and try to identify what the errors are without running it.
- Run the code and read the error message. What type of
NameErrordo you think this is? Is it a string with no quotes, a misspelled variable, or a variable that should have been defined but was not?- Fix the error.
- Repeat steps 2 and 3, until you have fixed all the errors.
for number in range(10):
    # use a if the number is a multiple of 3, otherwise use b
    if (Number % 3) == 0:
        message = message + a
    else:
        message = message + "b"
print(message)
Solution
- Python variable names are case sensitive:
numberandNumberrefer to different variables.- The variable
messageneeds to be initialized as an empty string.- We want to add the string
"a"tomessage, not the undefined variablea.message = "" for number in range(10): # use a if the number is a multiple of 3, otherwise use b if (number % 3) == 0: message = message + "a" else: message = message + "b" print(message)
Identifying Item Errors
- Read the code below and try to identify what the errors are without running it.
- Run the code, and read the error message. What type of error is it?
- Fix the error.
seasons = ['Spring', 'Summer', 'Fall', 'Winter']
print('My favorite season is ', seasons[4])
Solution
This list has 4 elements and the index to access the last element in the list is
3.seasons = ['Spring', 'Summer', 'Fall', 'Winter'] print('My favorite season is ', seasons[3])
Key Points
A for loop executes commands once for each value in a collection.
A
forloop is made up of a collection, a loop variable, and a body.The first line of the
forloop must end with a colon, and the body must be indented.Indentation is always meaningful in Python.
Loop variables can be called anything (but it is strongly advised to have a meaningful name to the looping variable).
The body of a loop can contain many statements.
Use
rangeto iterate over a sequence of numbers.The Accumulator pattern turns many values into one.
Conditionals
Overview
Teaching: 10 min
Exercises: 15 minQuestions
How can programs do different things for different data?
Objectives
Correctly write programs that use if and else statements and simple Boolean expressions (without logical operators).
Trace the execution of unnested conditionals and conditionals inside loops.
Use if statements to control whether or not a block of code is executed.
- An
ifstatement (more properly called a conditional statement) controls whether some block of code is executed or not. - Structure is similar to a
forstatement:- First line opens with
ifand ends with a colon - Body containing one or more statements is indented (usually by 4 spaces)
- First line opens with
mass = 3.54
if mass > 3.0:
    print(mass, 'is large')

mass = 2.07
if mass > 3.0:
    print (mass, 'is large')
3.54 is large
Conditionals are often used inside loops.
- Not much point using a conditional when we know the value (as above).
- But useful when we have a collection to process.
masses = [3.54, 2.07, 9.22, 1.86, 1.71]
for m in masses:
    if m > 3.0:
        print(m, 'is large')
3.54 is large
9.22 is large
Use else to execute a block of code when an if condition is not true.
elsecan be used following anif.- Allows us to specify an alternative to execute when the
ifbranch isn’t taken.
masses = [3.54, 2.07, 9.22, 1.86, 1.71]
for m in masses:
    if m > 3.0:
        print(m, 'is large')
    else:
        print(m, 'is small')
3.54 is large
2.07 is small
9.22 is large
1.86 is small
1.71 is small
Use elif to specify additional tests.
- May want to provide several alternative choices, each with its own test.
- Use
elif(short for “else if”) and a condition to specify these. - Always associated with an
if. - Must come before the
else(which is the “catch all”).
masses = [3.54, 2.07, 9.22, 1.86, 1.71]
for m in masses:
    if m > 9.0:
        print(m, 'is HUGE')
    elif m > 3.0:
        print(m, 'is large')
    else:
        print(m, 'is small')
3.54 is large
2.07 is small
9.22 is HUGE
1.86 is small
1.71 is small
Conditions are tested once, in order.
- Python steps through the branches of the conditional in order, testing each in turn.
- So ordering matters.
grade = 85
if grade >= 70:
    print('grade is C')
elif grade >= 80:
    print('grade is B')
elif grade >= 90:
    print('grade is A')
grade is C
- Does not automatically go back and re-evaluate if values change.
velocity = 10.0
if velocity > 20.0:
    print('moving too fast')
else:
    print('adjusting velocity')
    velocity = 50.0
adjusting velocity
- Often use conditionals in a loop to “evolve” the values of variables.
velocity = 10.0
for i in range(5): # execute the loop 5 times
    print(i, ':', velocity)
    if velocity > 20.0:
        print('moving too fast')
        velocity = velocity - 5.0
    else:
        print('moving too slow')
        velocity = velocity + 10.0
print('final velocity:', velocity)
0 : 10.0
moving too slow
1 : 20.0
moving too slow
2 : 30.0
moving too fast
3 : 25.0
moving too fast
4 : 20.0
moving too slow
final velocity: 30.0
Create a table showing variables’ values to trace a program’s execution.
| i | 0 | . | 1 | . | 2 | . | 3 | . | 4 | . |
| velocity | 10.0 | 20.0 | . | 30.0 | . | 25.0 | . | 20.0 | . | 30.0 |
- The program must have a
printstatement outside the body of the loop to show the final value ofvelocity, since its value is updated by the last iteration of the loop.
Compound Relations Using
and,or, and ParenthesesOften, you want some combination of things to be true. You can combine relations within a conditional using
andandor. Continuing the example above, suppose you havemass = [ 3.54, 2.07, 9.22, 1.86, 1.71] velocity = [10.00, 20.00, 30.00, 25.00, 20.00] i = 0 for i in range(5): if mass[i] > 5 and velocity[i] > 20: print("Fast heavy object. Duck!") elif mass[i] > 2 and mass[i] <= 5 and velocity[i] <= 20: print("Normal traffic") elif mass[i] <= 2 and velocity[i] <= 20: print("Slow light object. Ignore it") else: print("Whoa! Something is up with the data. Check it")Just like with arithmetic, you can and should use parentheses whenever there is possible ambiguity. A good general rule is to always use parentheses when mixing
andandorin the same condition. That is, instead of:if mass[i] <= 2 or mass[i] >= 5 and velocity[i] > 20:write one of these:
if (mass[i] <= 2 or mass[i] >= 5) and velocity[i] > 20:
if mass[i] <= 2 or (mass[i] >= 5 and velocity[i] > 20):
so it is perfectly clear to a reader (and to Python) what you really mean.
Tracing Execution
What does this program print?
pressure = 71.9
if pressure > 50.0:
    pressure = 25.0
elif pressure <= 50.0:
    pressure = 0.0
print(pressure)
Solution
25.0
Trimming Values
Fill in the blanks so that this program creates a new list containing zeroes where the original list’s values were negative and ones where the original list’s values were positive.
original = [-1.5, 0.2, 0.4, 0.0, -1.3, 0.4]
result = ____
for value in original:
    if ____:
        result.append(0)
    else:
        ____
print(result)
[0, 1, 1, 1, 0, 1]Solution
original = [-1.5, 0.2, 0.4, 0.0, -1.3, 0.4]
result = []
for value in original:
    if value < 0.0:
        result.append(0)
    else:
        result.append(1)
print(result)
Processing Small Files
Modify this program so that it only processes files with fewer than 50 records.
import glob
import pandas as pd
for filename in glob.glob('data/*.csv'):
    contents = pd.read_csv(filename)
    ____:
        print(filename, len(contents))
Solution
import glob
import pandas as pd
for filename in glob.glob('data/*.csv'):
    contents = pd.read_csv(filename)
    if len(contents) < 50:
        print(filename, len(contents))
Initializing
Modify this program so that it finds the largest and smallest values in the list no matter what the range of values originally is.
values = [...some test data...]
smallest, largest = None, None
for v in values:
    if ____:
        smallest, largest = v, v
    ____:
        smallest = min(____, v)
        largest = max(____, v)
print(smallest, largest)
What are the advantages and disadvantages of using this method to find the range of the data?
Solution
values = [-2,1,65,78,-54,-24,100]
smallest, largest = None, None
for v in values:
    if smallest == None and largest == None:
        smallest, largest = v, v
    else:
        smallest = min(smallest, v)
        largest = max(largest, v)
print(smallest, largest)
It can be argued that an advantage of using this method would be to make the code more readable. However, a disadvantage is that this code is not efficient, as the
valueslist is iterated three times: once in theforloop statement, then again when both theminandmaxfunctions are called. The most efficient method, while maintaining readability, would be to iterate the list only once:values = [-2,1,65,78,-54,-24,100] smallest, largest = None, None for v in values: if smallest == None or v < smallest: smallest = v if largest == None or v > largest: largest = v print(smallest, largest)
Using Functions With Conditionals in Pandas
Functions will often contain conditionals. Here is a short example that will indicate which quartile the argument is in based on hand-coded values for the quartile cut points.
def calculate_life_quartile(exp): if exp < 58.41: # This observation is in the first quartile return 1 elif exp >= 58.41 and exp < 67.05: # This observation is in the second quartile return 2 elif exp >= 67.05 and exp < 71.70: # This observation is in the third quartile return 3 elif exp >= 71.70: # This observation is in the fourth quartile return 4 else: # This observation has bad data return None calculate_life_quartile(62.5)2That function would typically be used within a
forloop, but Pandas has a different, more efficient way of doing the same thing, and that is by applying a function to a dataframe or a portion of a dataframe. Here is an example, using the definition above.data = pd.read_csv('data/gapminder_all.csv') data['life_qrtl'] = data['lifeExp_1952'].apply(calculate_life_quartile)There is a lot in that second line, so let’s take it piece by piece. On the right side of the
=we start withdata['lifeExp'], which is the column in the dataframe calleddatalabeledlifExp. We use theapply()to do what it says, apply thecalculate_life_quartileto the value of this column for every row in the dataframe.
Key Points
Use
ifstatements to control whether or not a block of code is executed.Conditionals are often used inside loops.
Use
elseto execute a block of code when anifcondition is not true.Use
elifto specify additional tests.Conditions are tested once, in order.
Create a table showing variables’ values to trace a program’s execution.
Looping Over Data Sets
Overview
Teaching: 5 min
Exercises: 10 minQuestions
How can I process many data sets with a single command?
Objectives
Be able to read and write globbing expressions that match sets of files.
Use glob to create lists of files.
Write for loops to perform operations on files given their names in a list.
Use a for loop to process files given a list of their names.
- A filename is a character string.
- And lists can contain character strings.
import pandas as pd
for filename in ['data/gapminder_gdp_africa.csv', 'data/gapminder_gdp_asia.csv']:
    data = pd.read_csv(filename, index_col='country')
    print(filename, data.min())
data/gapminder_gdp_africa.csv gdpPercap_1952    298.846212
gdpPercap_1957    335.997115
gdpPercap_1962    355.203227
gdpPercap_1967    412.977514
⋮ ⋮ ⋮
gdpPercap_1997    312.188423
gdpPercap_2002    241.165877
gdpPercap_2007    277.551859
dtype: float64
data/gapminder_gdp_asia.csv gdpPercap_1952    331
gdpPercap_1957    350
gdpPercap_1962    388
gdpPercap_1967    349
⋮ ⋮ ⋮
gdpPercap_1997    415
gdpPercap_2002    611
gdpPercap_2007    944
dtype: float64
Use glob.glob to find sets of files whose names match a pattern.
- In Unix, the term “globbing” means “matching a set of files with a pattern”.
- The most common patterns are:
*meaning “match zero or more characters”?meaning “match exactly one character”
- Python’s standard library contains the
globmodule to provide pattern matching functionality - The
globmodule contains a function also calledglobto match file patterns - E.g.,
glob.glob('*.txt')matches all files in the current directory whose names end with.txt. - Result is a (possibly empty) list of character strings.
import glob
print('all csv files in data directory:', glob.glob('data/*.csv'))
all csv files in data directory: ['data/gapminder_all.csv', 'data/gapminder_gdp_africa.csv', \
'data/gapminder_gdp_americas.csv', 'data/gapminder_gdp_asia.csv', 'data/gapminder_gdp_europe.csv', \
'data/gapminder_gdp_oceania.csv']
print('all PDB files:', glob.glob('*.pdb'))
all PDB files: []
Use glob and for to process batches of files.
- Helps a lot if the files are named and stored systematically and consistently so that simple patterns will find the right data.
for filename in glob.glob('data/gapminder_*.csv'):
    data = pd.read_csv(filename)
    print(filename, data['gdpPercap_1952'].min())
data/gapminder_all.csv 298.8462121
data/gapminder_gdp_africa.csv 298.8462121
data/gapminder_gdp_americas.csv 1397.717137
data/gapminder_gdp_asia.csv 331.0
data/gapminder_gdp_europe.csv 973.5331948
data/gapminder_gdp_oceania.csv 10039.59564
- This includes all data, as well as per-region data.
- Use a more specific pattern in the exercises to exclude the whole data set.
- But note that the minimum of the entire data set is also the minimum of one of the data sets, which is a nice check on correctness.
Determining Matches
Which of these files is not matched by the expression
glob.glob('data/*as*.csv')?
data/gapminder_gdp_africa.csvdata/gapminder_gdp_americas.csvdata/gapminder_gdp_asia.csvSolution
1 is not matched by the glob.
Minimum File Size
Modify this program so that it prints the number of records in the file that has the fewest records.
import glob
import pandas as pd
fewest = ____
for filename in glob.glob('data/*.csv'):
    dataframe = pd.____(filename)
    fewest = min(____, dataframe.shape[0])
print('smallest file has', fewest, 'records')
Note that the
DataFrame.shape()method returns a tuple with the number of rows and columns of the data frame.Solution
import glob
import pandas as pd
fewest = float('Inf')
for filename in glob.glob('data/*.csv'):
    dataframe = pd.read_csv(filename)
    fewest = min(fewest, dataframe.shape[0])
print('smallest file has', fewest, 'records')
Comparing Data
Write a program that reads in the regional data sets and plots the average GDP per capita for each region over time in a single chart.
Solution
This solution builds a useful legend by using the string
splitmethod to extract theregionfrom the path ‘data/gapminder_gdp_a_specific_region.csv’.import glob import pandas as pd import matplotlib.pyplot as plt fig, ax = plt.subplots(1,1) for filename in glob.glob('data/gapminder_gdp*.csv'): dataframe = pd.read_csv(filename) # extract <region> from the filename, expected to be in the format 'data/gapminder_gdp_<region>.csv'. # we will split the string using the split method and `_` as our separator, # retrieve the last string in the list that split returns (`<region>.csv`), # and then remove the `.csv` extension from that string. region = filename.split('_')[-1][:-4] dataframe.mean().plot(ax=ax, label=region) plt.legend() plt.show()
Dealing with File Paths
The
pathlibmodule provides useful abstractions for file and path manipulation like returning the name of a file without the file extension. This is very useful when looping over files and directories. In the example below, we create aPathobject and inspect its attributes.from pathlib import Path p = Path("data/gapminder_gdp_africa.csv") print(p.parent), print(p.stem), print(p.suffix)data gapminder_gdp_africa .csvHint: It is possible to check all available attributes and methods on the
Pathobject with thedir()function!
Key Points
Use a
forloop to process files given a list of their names.Use
glob.globto find sets of files whose names match a pattern.Use
globandforto process batches of files.
Writing Functions
Overview
Teaching: 10 min
Exercises: 15 minQuestions
How can I create my own functions?
Objectives
Explain and identify the difference between function definition and function call.
Write a function that takes a small, fixed number of arguments and produces a single result.
Break programs down into functions to make them easier to understand.
- Human beings can only keep a few items in working memory at a time.
- Understand larger/more complicated ideas by understanding and combining pieces.
- Components in a machine.
- Lemmas when proving theorems.
- Functions serve the same purpose in programs.
- Encapsulate complexity so that we can treat it as a single “thing”.
- Also enables re-use.
- Write one time, use many times.
Define a function using def with a name, parameters, and a block of code.
- Begin the definition of a new function with
def. - Followed by the name of the function.
- Must obey the same rules as variable names.
- Then parameters in parentheses.
- Empty parentheses if the function doesn’t take any inputs.
- We will discuss this in detail in a moment.
- Then a colon.
- Then an indented block of code.
def print_greeting():
    print('Hello!')
Defining a function does not run it.
- Defining a function does not run it.
- Like assigning a value to a variable.
- Must call the function to execute the code it contains.
print_greeting()
Hello!
Arguments in call are matched to parameters in definition.
- Functions are most useful when they can operate on different data.
- Specify parameters when defining a function.
- These become variables when the function is executed.
- Are assigned the arguments in the call (i.e., the values passed to the function).
- If you don’t name the arguments when using them in the call, the arguments will be matched to parameters in the order the parameters are defined in the function.
def print_date(year, month, day):
    joined = str(year) + '/' + str(month) + '/' + str(day)
    print(joined)

print_date(1871, 3, 19)
1871/3/19
Or, we can name the arguments when we call the function, which allows us to specify them in any order:
print_date(month=3, day=19, year=1871)
1871/3/19
- Via Twitter:
()contains the ingredients for the function while the body contains the recipe.
Functions may return a result to their caller using return.
- Use
return ...to give a value back to the caller. - May occur anywhere in the function.
- But functions are easier to understand if
returnoccurs:- At the start to handle special cases.
- At the very end, with a final result.
def average(values):
    if len(values) == 0:
        return None
    return sum(values) / len(values)
a = average([1, 3, 4])
print('average of actual values:', a)
average of actual values: 2.6666666666666665
print('average of empty list:', average([]))
average of empty list: None
- Remember: every function returns something.
- A function that doesn’t explicitly
returna value automatically returnsNone.
result = print_date(1871, 3, 19)
print('result of call is:', result)
1871/3/19
result of call is: None
Identifying Syntax Errors
- Read the code below and try to identify what the errors are without running it.
- Run the code and read the error message. Is it a
SyntaxErroror anIndentationError?- Fix the error.
- Repeat steps 2 and 3 until you have fixed all the errors.
def another_function
  print("Syntax errors are annoying.")
   print("But at least python tells us about them!")
  print("So they are usually not too hard to fix.")
Solution
def another_function():
  print("Syntax errors are annoying.")
  print("But at least Python tells us about them!")
  print("So they are usually not too hard to fix.")
Definition and Use
What does the following program print?
def report(pressure):
    print('pressure is', pressure)

print('calling', report, 22.5)
Solution
calling <function report at 0x7fd128ff1bf8> 22.5A function call always needs parenthesis, otherwise you get memory address of the function object. So, if we wanted to call the function named report, and give it the value 22.5 to report on, we could have our function call as follows
print("calling")
report(22.5)
calling pressure is 22.5
Order of Operations
What’s wrong in this example?
 result = print_time(11, 37, 59)

 def print_time(hour, minute, second):
    time_string = str(hour) + ':' + str(minute) + ':' + str(second)
    print(time_string)
After fixing the problem above, explain why running this example code:
 result = print_time(11, 37, 59)
 print('result of call is:', result)
gives this output:
 11:37:59
 result of call is: None
Why is the result of the call
None?Solution
The problem with the example is that the function
print_time()is defined after the call to the function is made. Python doesn’t know how to resolve the nameprint_timesince it hasn’t been defined yet and will raise aNameErrore.g.,NameError: name 'print_time' is not definedThe first line of output
11:37:59is printed by the first line of code,result = print_time(11, 37, 59)that binds the value returned by invokingprint_timeto the variableresult. The second line is from the second print call to print the contents of theresultvariable.
print_time()does not explicitlyreturna value, so it automatically returnsNone.
Encapsulation
Fill in the blanks to create a function that takes a single filename as an argument, loads the data in the file named by the argument, and returns the minimum value in that data.
import pandas as pd

def min_in_data(____):
    data = ____
    return ____
Solution
import pandas as pd

def min_in_data(filename):
    data = pd.read_csv(filename)
    return data.min()
Find the First
Fill in the blanks to create a function that takes a list of numbers as an argument and returns the first negative value in the list. What does your function do if the list is empty? What if the list has no negative numbers?
def first_negative(values):
    for v in ____:
        if ____:
            return ____
Solution
def first_negative(values):
    for v in values:
        if v < 0:
            return v
If an empty list or a list with all positive values is passed to this function, it returns
None:my_list = [] print(first_negative(my_list))None
Calling by Name
Earlier we saw this function:
def print_date(year, month, day):
    joined = str(year) + '/' + str(month) + '/' + str(day)
    print(joined)
We saw that we can call the function using named arguments, like this:
print_date(day=1, month=2, year=2003)
- What does
print_date(day=1, month=2, year=2003)print?- When have you seen a function call like this before?
- When and why is it useful to call functions this way?
Solution
2003/2/1- We saw examples of using named arguments when working with the pandas library. For example, when reading in a dataset using
data = pd.read_csv('data/gapminder_gdp_europe.csv', index_col='country'), the last argumentindex_colis a named argument.- Using named arguments can make code more readable since one can see from the function call what name the different arguments have inside the function. It can also reduce the chances of passing arguments in the wrong order, since by using named arguments the order doesn’t matter.
Encapsulation of an If/Print Block
The code below will run on a label-printer for chicken eggs. A digital scale will report a chicken egg mass (in grams) to the computer and then the computer will print a label.
Please re-write the code so that the if-block is folded into a function.
import random
for i in range(10):

    # simulating the mass of a chicken egg
    # the (random) mass will be 70 +/- 20 grams
    mass = 70 + 20.0 * (2.0 * random.random() - 1.0)

    print(mass)

    # egg sizing machinery prints a label
    if mass >= 85:
       print("jumbo")
    elif mass >= 70:
       print("large")
    elif mass < 70 and mass >= 55:
       print("medium")
    else:
       print("small")
The simplified program follows. What function definition will make it functional?
# revised version
import random
for i in range(10):

    # simulating the mass of a chicken egg
    # the (random) mass will be 70 +/- 20 grams
    mass = 70 + 20.0 * (2.0 * random.random() - 1.0)

    print(mass, get_egg_label(mass))
- Create a function definition for
get_egg_label()that will work with the revised program above. Note that theget_egg_label()function’s return value will be important. Sample output from the above program would be71.23 large.- A dirty egg might have a mass of more than 90 grams, and a spoiled or broken egg will probably have a mass that’s less than 50 grams. Modify your
get_egg_label()function to account for these error conditions. Sample output could be25 too light, probably spoiled.Solution
def get_egg_label(mass):
    # egg sizing machinery prints a label
    egg_label = "Unlabelled"
    if mass >= 90:
        egg_label = "warning: egg might be dirty"
    elif mass >= 85:
        egg_label = "jumbo"
    elif mass >= 70:
        egg_label = "large"
    elif mass < 70 and mass >= 55:
        egg_label = "medium"
    elif mass < 50:
        egg_label = "too light, probably spoiled"
    else:
        egg_label = "small"
    return egg_label
Encapsulating Data Analysis
Assume that the following code has been executed:
import pandas as pd

df = pd.read_csv('data/gapminder_gdp_asia.csv', index_col=0)
japan = df.loc['Japan']
Complete the statements below to obtain the average GDP for Japan across the years reported for the 1980s.
 year = 1983
 gdp_decade = 'gdpPercap_' + str(year // ____)
 avg = (japan.loc[gdp_decade + ___] + japan.loc[gdp_decade + ___]) / 2
Abstract the code above into a single function.
 def avg_gdp_in_decade(country, continent, year):
     df = pd.read_csv('data/gapminder_gdp_'+___+'.csv',delimiter=',',index_col=0)
     ____
     ____
     ____
     return avg
How would you generalize this function if you did not know beforehand which specific years occurred as columns in the data? For instance, what if we also had data from years ending in 1 and 9 for each decade? (Hint: use the columns to filter out the ones that correspond to the decade, instead of enumerating them in the code.)
Solution
The average GDP for Japan across the years reported for the 1980s is computed with:
 year = 1983
 gdp_decade = 'gdpPercap_' + str(year // 10)
 avg = (japan.loc[gdp_decade + '2'] + japan.loc[gdp_decade + '7']) / 2
That code as a function is:
def avg_gdp_in_decade(country, continent, year): df = pd.read_csv('data/gapminder_gdp_' + continent + '.csv', index_col=0) c = df.loc[country] gdp_decade = 'gdpPercap_' + str(year // 10) avg = (c.loc[gdp_decade + '2'] + c.loc[gdp_decade + '7'])/2 return avgTo obtain the average for the relevant years, we need to loop over them:
def avg_gdp_in_decade(country, continent, year): df = pd.read_csv('data/gapminder_gdp_' + continent + '.csv', index_col=0) c = df.loc[country] gdp_decade = 'gdpPercap_' + str(year // 10) total = 0.0 num_years = 0 for yr_header in c.index: # c's index contains reported years if yr_header.startswith(gdp_decade): total = total + c.loc[yr_header] num_years = num_years + 1 return total/num_yearsThe function can now be called by:
avg_gdp_in_decade('Japan','asia',1983)20880.023800000003
Simulating a dynamical system
In mathematics, a dynamical system is a system in which a function describes the time dependence of a point in a geometrical space. A canonical example of a dynamical system is the logistic map, a growth model that computes a new population density (between 0 and 1) based on the current density. In the model, time takes discrete values 0, 1, 2, …
Define a function called
logistic_mapthat takes two inputs:x, representing the current population (at timet), and a parameterr = 1. This function should return a value representing the state of the system (population) at timet + 1, using the mapping function:
f(t+1) = r * f(t) * [1 - f(t)]Using a
fororwhileloop, iterate thelogistic_mapfunction defined in part 1, starting from an initial population of 0.5, for a period of timet_final = 10. Store the intermediate results in a list so that after the loop terminates you have accumulated a sequence of values representing the state of the logistic map at timest = [0,1,...,t_final]. Print this list to see the evolution of the population.Encapsulate the logic of your loop into a function called
iteratethat takes the initial population as its first input, the parametert_finalas its second input and the parameterras its third input. The function should return the list of values representing the state of the logistic map at timest = [0,1,...,t_final]. Run this function for periodst_final = 100and1000and print some of the values. Is the population trending toward a steady state?Solution
def logistic_map(x, r): return r * x * (1 - x)initial_population = 0.5 t_final = 10 r = 1.0 population = [initial_population] for t in range(1, t_final): population.append( logistic_map(population[t-1], r) )def iterate(initial_population, t_final, r): population = [initial_population] for t in range(1, t_final): population.append( logistic_map(population[t-1], r) ) return population for period in (10, 100, 1000): population = iterate(0.5, period, 1) print(population[-1])0.07508929631879595 0.009485759503982033 0.0009923756709128578The population seems to be approaching zero.
Key Points
Break programs down into functions to make them easier to understand.
Define a function using
defwith a name, parameters, and a block of code.Defining a function does not run it.
Arguments in call are matched to parameters in definition.
Functions may return a result to their caller using
return.